Main Content
Article
Potentiometric Surface Mapping (1:48,000) Overview
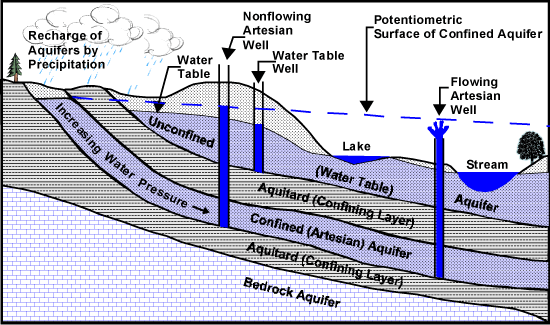
Most of the groundwater systems in Indiana contain both aquifers and confining layers. Unconsolidated aquifers consist primarily of sand and gravel whereas the major consolidated aquifers are carbonates (limestone and dolomite) and sandstones. Aquifers have porosity and permeability sufficient to absorb, store and transmit water in usable quantities. Aquitards are confining layers and consist of materials with low permeability which inhibit groundwater movement. An unconsolidated aquitard typically is a layer of clay while an example of a bedrock aquitard might be a consolidated shale unit. An aquitard overlying an aquifer may limit the recharge to the aquifer but may also protect the aquifer from surface contamination. Where an aquitard directly overlies an aquifer, the water in the aquifer is said to be confined because the aquitard prevents or restricts upward movement of water from the aquifer. Such an aquifer is referred to as a confined or artesian aquifer. Water in confined aquifers exists under hydrostatic pressure which exceeds atmospheric pressure; and wells completed in confined aquifers have water levels that rise above the water-bearing formation until the local hydrostatic pressure in the well is equal to the atmospheric pressure. Such wells may or may not be flowing wells (Figure 1). In contrast, water in an unconfined aquifer exists under atmospheric pressure; and wells that are completed in such aquifers have water levels that correspond to the local water table. An unconfined aquifer is also referred to as a water table aquifer. The static water level is the level of water in a water well that is not influenced by pumping. The potentiometric surface is the level to which water will rise in tightly cased wells. A water table map shows the spatial distribution of water levels in wells in an unconfined aquifer, and is a type of potentiometric surface map. Water level maps for both confined and unconfined aquifers are typically referred to as potentiometric surface maps.

Figure 1. Aquifer types and groundwater movement.
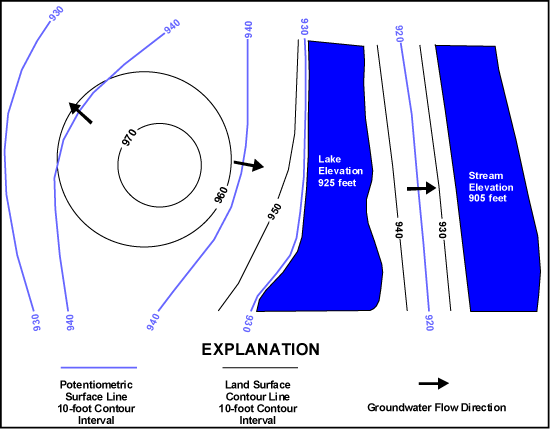
Groundwater level measurements can provide important information about local groundwater resources. For example, because differences in water- level elevation provide potential for flow, spatial mapping of water-level elevations can permit identification of regional groundwater flow direction. In general, the potentiometric surface for a water table map follows the overlying land-surface topography and intersects the land surface at major streams, lakes, or wetlands. The expected flow path is downslope or perpendicular to the potentiometric surface contours (Figure 2). The maps compiled through the Potentiometric Surface Mapping (1:48,000) project show generalized composites of the potentiometric surface and are not intended to be a substitute for local site-specific conditions. For the unconsolidated aquifers an attempt was made to utilize shallow (100 feet or less) water well data but because of complicated geologic conditions, deeper (greater than 100 feet) well data are used in places where shallow data are sparse. In addition, most water wells are under confined conditions.

Figure 2. Schematic showing groundwater flow direction perpendicular to potentiometric surface lines.
The potentiometric surface maps produced, under the Potentiometric Surface Mapping (1:48,000) project, depicts the elevation to which water levels will rise in wells. The maps are created by plotting elevations of the static water level and then generating contours or lines of equal elevation. Static water levels used to develop the potentiometric surface map are from wells completed at various depths and under confined and unconfined conditions. Natural groundwater flow is from areas of recharge toward areas of discharge. Depths to the potentiometric surface do not represent appropriate depths for water wells. Instead, wells must be completed in the water-yielding formation, with depth into the aquifer based primarily on local geologic conditions, such as thickness and lateral extent of the aquifer, in combination with the potentiometric surface. The groundwater level within an aquifer fluctuates constantly in response to rainfall, evapotranspiration, barometric pressure, groundwater movement (including recharge and discharge), and groundwater pumpage. However, the response time for most natural groundwater level fluctuations is controlled predominantly by the local and regional geology.
Besides regional groundwater flow direction and areas of recharge and discharge, the potentiometric surface maps could be used: to calculate hydraulic gradients and groundwater velocity; in conjunction with the water well records to determine groundwater availability, estimates of aquifer yield, and changes in static water levels over time; for technical studies; in conjunction with groundwater models and to analyze changes in water levels related to pumpage. The water well records predominantly date from 1959 onwards with the water well data representing various seasonal and hydrologic conditions. It is not recommended the potentiometric surface maps be used for purposes other than general estimates as conditions at a specific site may vary considerably from typical conditions shown on the maps.
